The S&P
Make the Market
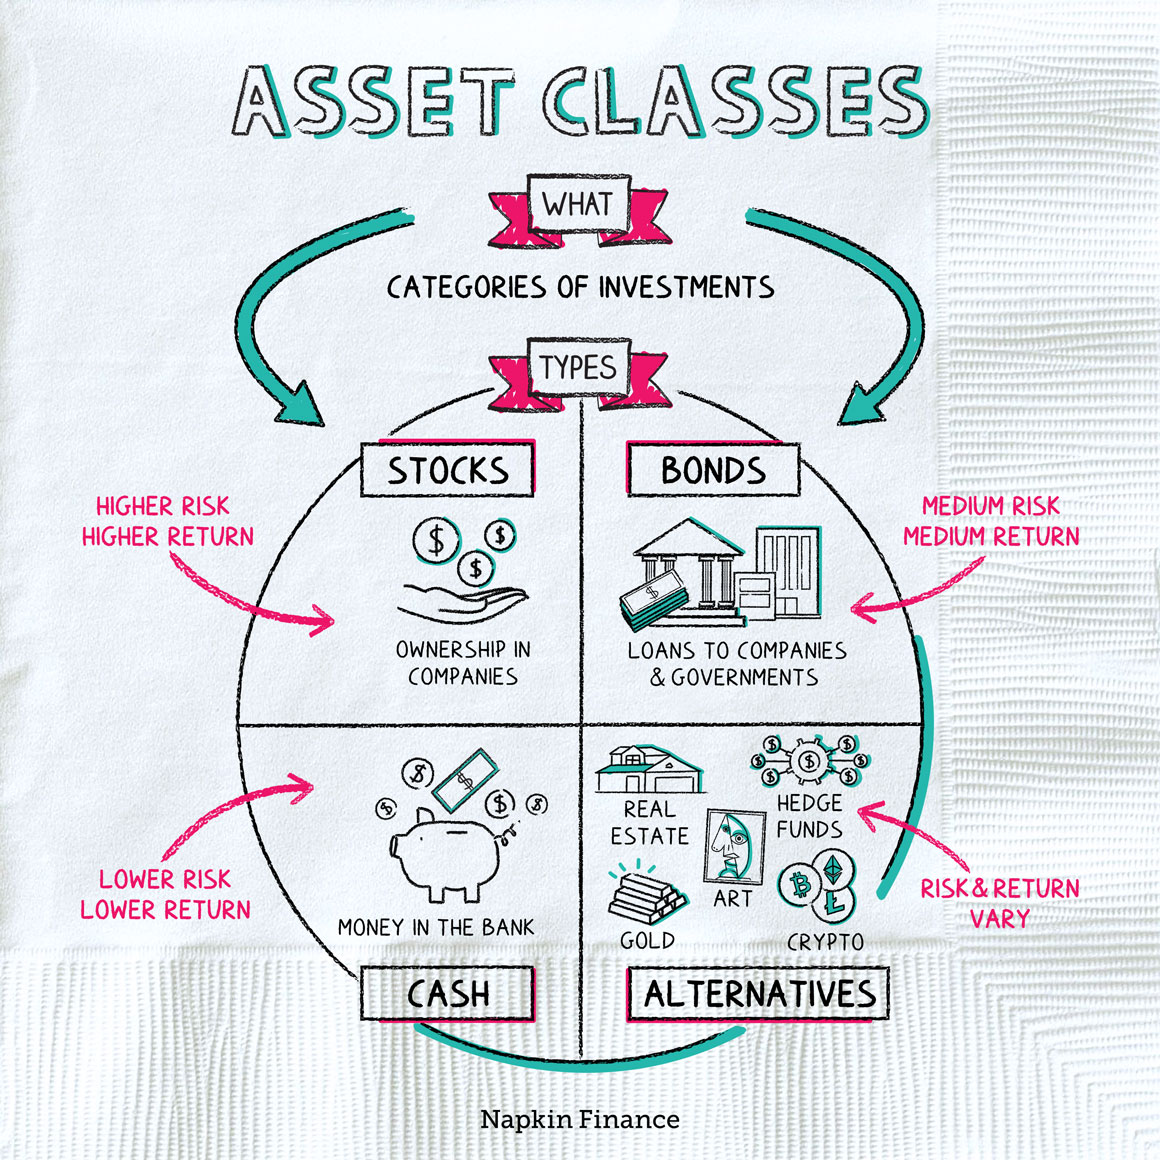
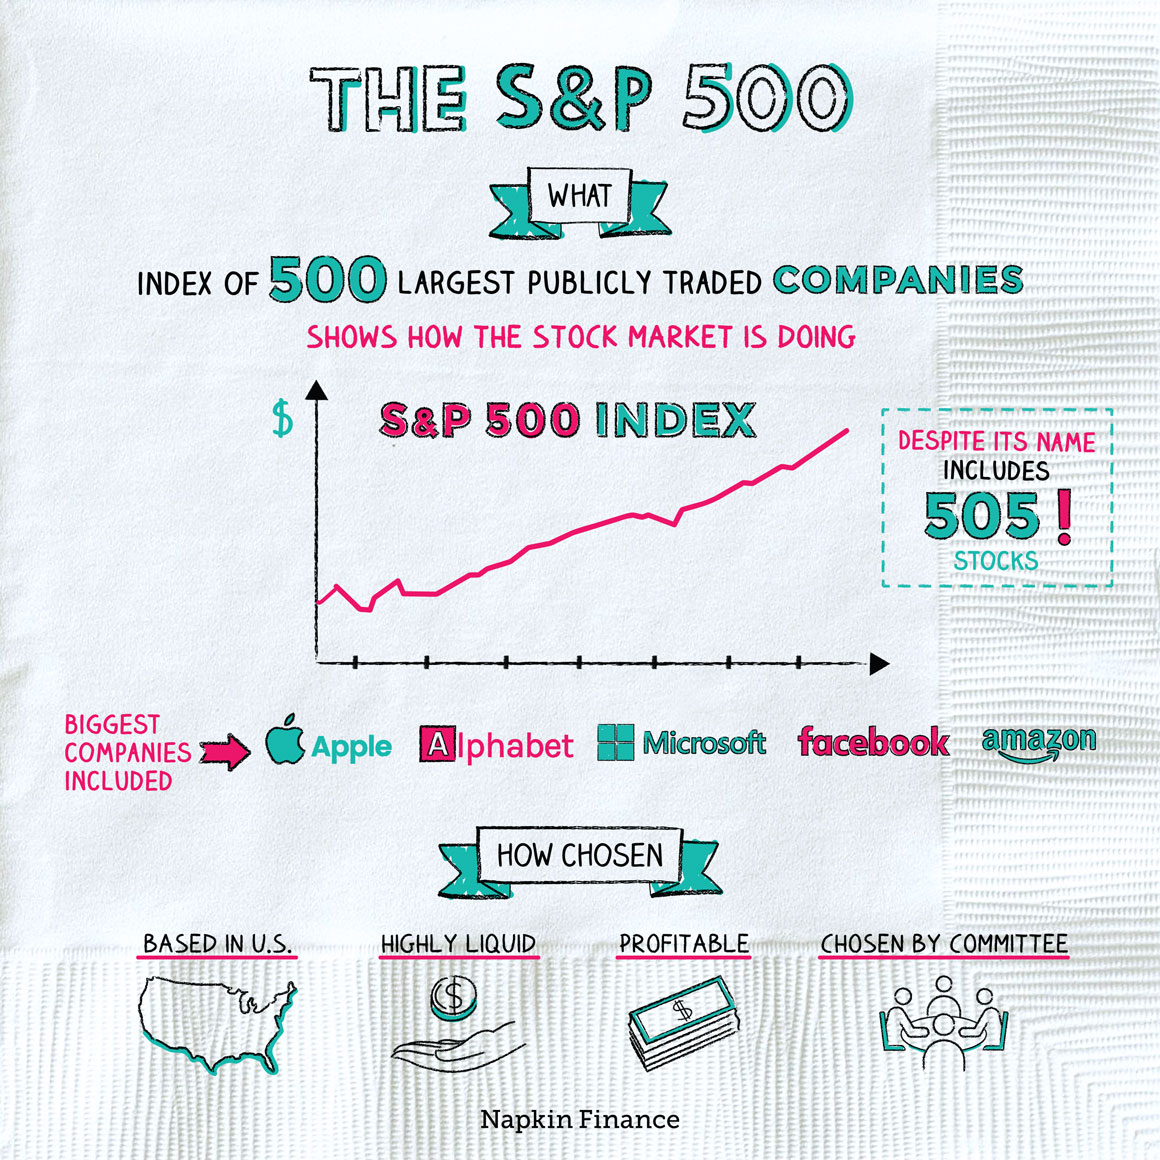
The Standard & Poor’s 500 Index—also known as the S&P 500, or just the S&P—is an index that tracks the stock price movements of 500 of the largest U.S. publicly traded companies.
The S&P is often considered the single most important measure of how the U.S. stock market is doing.
Although experts often talk about “the stock market” as though it’s one big entity, it’s really just the collection of every individual stock. In the U.S., that amounts to around 4,000 individual publicly traded companies (or more, depending on how you count).
To get an idea of how the whole stock market is doing, it’s easier to measure the performance of only some of the stocks rather than all of them (similar to how political pollsters survey a few thousand voters, instead of millions of them, to find out how candidates are doing).
An index such as the S&P is a cross section of the market that provides an estimate as to how the market as a whole is doing. Because it’s such a broad index and because stocks tend to move together—going up at the same time and going down at the same time—it’s a pretty good measure.
To become part of the S&P, companies have to meet a number of criteria, including:
- U.S. based
- Companies typically have to be headquartered in the U.S., run most of their operations in the U.S., or do most of their sales in the U.S. (or some combination of those factors).
- Size
- The index tracks only large companies.
- To be included, companies generally have to have a market capitalization (which is the total value of all the company’s shares) of more than $8 billion.
- Profitability
- Companies need to (for the most part) be producing positive profits, not ongoing losses, to be included.
- Easy to invest in
- Companies have to have shares that are listed on a major exchange.
- They also have to have enough shares trading so that it’s easy to buy and sell their stock. (For example, a company whose founder owns 99% of shares might not meet this criteria.)
And not all companies that meet those requirements are included. The index is limited to 500 companies, and at the end of the day it’s up to a group of humans to make judgment calls as to which mix of companies will best represent the U.S. economy.
The actual math of how the index is calculated can get complicated, but the idea is simple: Each stock has a percentage weighting in the index. A price move by any stock that’s included in the index affects the overall index, but moves by stocks with larger weightings affect it more:
|
Stock has a 5% weighting in the index |
Stock has a 1% weighting in the index |
Larger companies have larger weightings in the index. (More specifically, their weightings are tied to their market capitalizations.)
This means that if Apple stock, for example, has a good or bad day in the market, it affects the S&P much more than if shares of Foot Locker (which is about 0.5% the size of Apple) have a good or bad day.
The other two main U.S. market indexes are the Dow Jones Industrial Average (aka “the Dow”) and the Nasdaq. Here’s how those compare to the S&P:
| S&P | Dow | Nasdaq | |
| How many stocks? | 500 | 30 | 3,000+ |
| Main focus? |
|
|
|
| How weighted? |
|
|
|
The S&P is a stock market index, which means it provides an estimate of how the overall market is doing. The S&P isn’t the only U.S. stock market index, but it’s broader than the alternatives and so is often considered to be the best measure. The index tracks 500 large U.S. companies. Although there are elaborate criteria that help determine which companies can be included in the index and which can’t, ultimately the index is run by a group of people who decide which companies are in and which are out.
- Although you can’t invest directly in the S&P itself, you can invest in any of the handful of exchange-traded funds (ETFs) or index funds that track the S&P.
- More than $8 trillion is indexed to the S&P—including through ETFs, index funds, and private investment vehicles that track the index.
- The S&P was created in 1957, but it’s still a spring chicken compared with the Dow, which was first calculated in 1896.
- The S&P is one of the most watched and most important stock market indexes.
- Like other indexes, the S&P represents a cross section of U.S. stocks and is used to provide an estimate of how the overall stock market is performing.
- To be included in the index—which tracks 500 companies—companies must meet a certain size threshold, be easy to invest in, and generally turn a profit, among other criteria.
- Although it isn’t the only major stock index, it’s broader than the other best-known indexes and so is typically considered to be a more complete representation of the U.S. economy.