Technical Analysis
Off the Charts
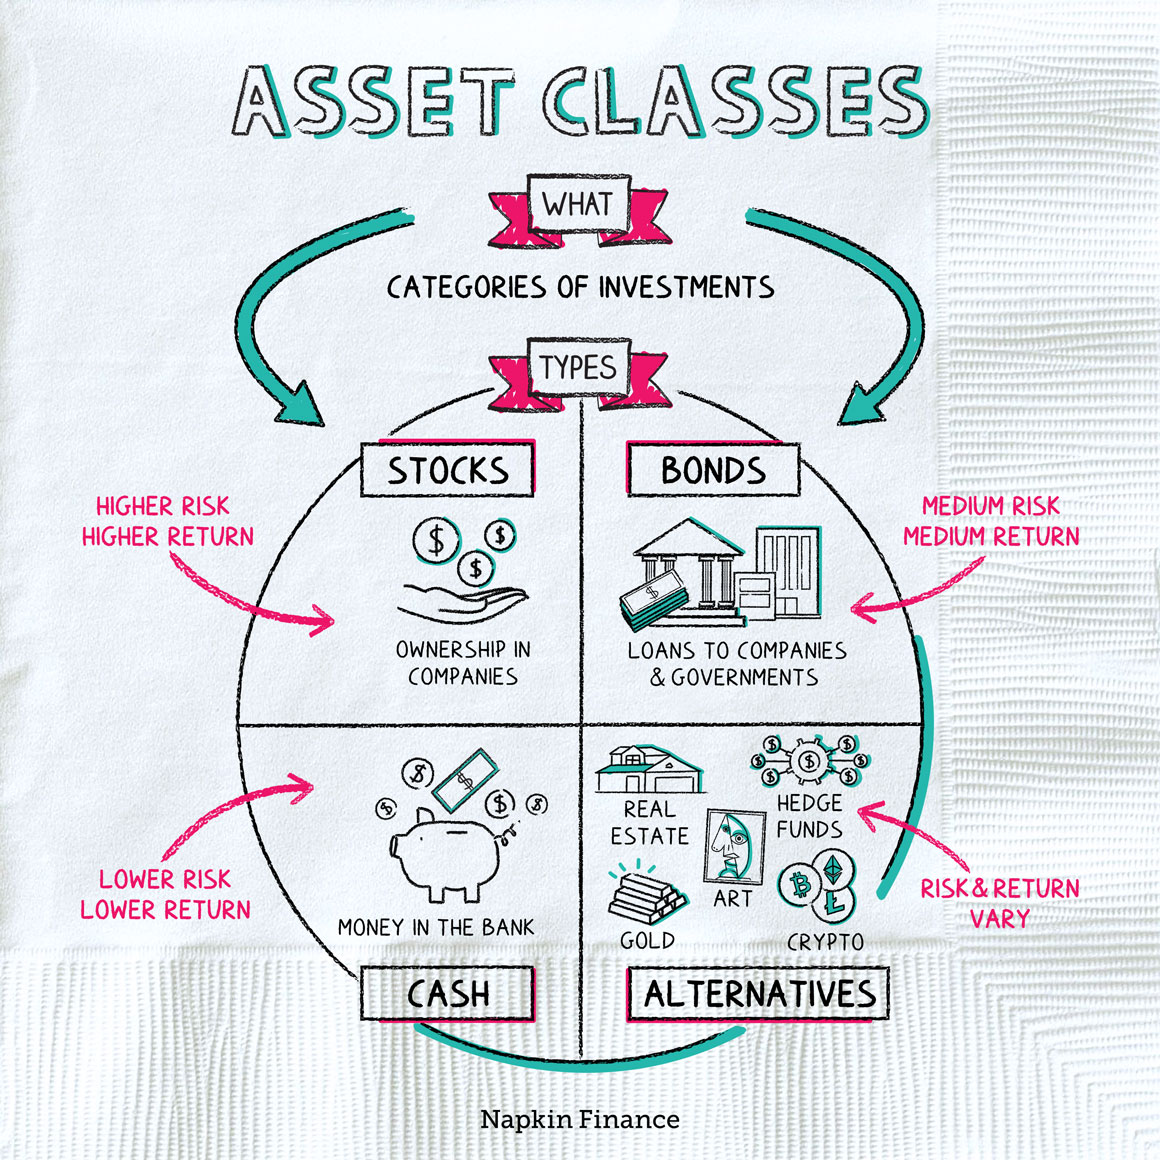
Technical analysis means using stock price charts to try to predict future stock price movements.
It involves looking at patterns and trends in stock prices to try to determine when to buy or sell stocks.
Investors who use technical analysis generally rely on a variety of types of charts and data, including:
- A stock’s price—whether showing a stock’s intraday or day-by-day movements
- Moving averages—which smooth out a stock’s daily movements to show its longer-term trends
- Candlestick charts—which visually show a stock’s opening, closing, high, and low prices for each trading day
- Volatility data—some types of charts show stock price bands, with wider bands when the price is more volatile and narrower bands when it’s less volatile
- Volume data—which shows the number of shares trading on a given day and can provide extra insight into whether other investors are feeling bullish or bearish on a stock
There isn’t just one way to use technical analysis. But it often centers around looking for familiar patterns in stock price movements.
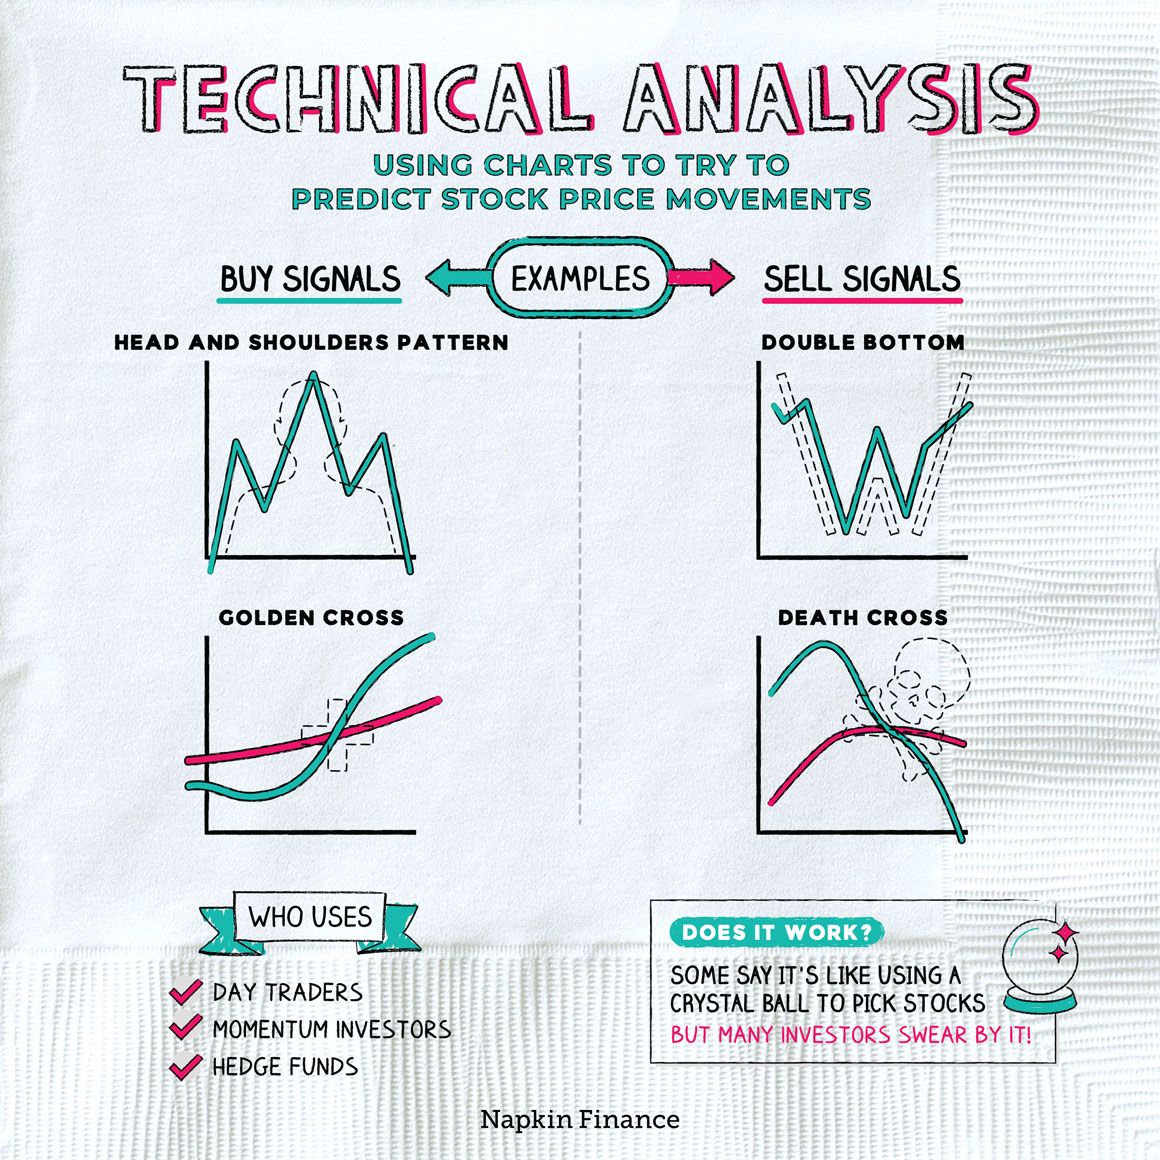
Here are some of the patterns it may aim to identify:
| What it looks like | Indicates price should | |
| Head and shoulders pattern | Stock’s price hits three peaks—with a lower peak, a higher one, then a lower one again | Fall |
| Double bottom | Stock’s price hits two bottoms, both around the same price, before bouncing up after each | Rise |
| Golden cross | Stock’s 50-day moving average crosses up and over its 200-day moving average | Rise |
| Death cross | Stock’s 50-day moving average crosses down and over its 200-day moving average | Fall |
You can understand technical analysis by contrasting it with fundamental analysis.
While technical analysis is primarily focused on analyzing stock price charts, fundamental analysis centers on gaining a deep understanding of individual companies and their business prospects.
| Technical analysis | Fundamental analysis | |
| Looks at |
|
|
| Tries to identify | Where a given stock will go next | What a given stock is really worth |
| Used by |
|
|
An investor who uses fundamental analysis will typically want to invest in companies with strong business prospects.
By contrast, an investor who follows technical analysis might not care if the underlying company is on a tear or on the rocks—as long as they feel the stock’s price movements are predicting big gains.
Technical analysis is controversial. Some investors argue it’s not all that different from using a Ouija board to pick stocks. But others (including some sophisticated professional investors) swear by it. And it’s possible to find studies that support each side’s opinion.
In the end, there are no surefire investment strategies that make money 100% of the time. Technical analysis is one tool that lots of investors find useful—either on its own or alongside other approaches.
Technical analysis is an investing approach that relies on stock price charts and patterns to try to identify when to buy and when to sell. Investors who use technical analysis may look at moving averages, volume data, and volatility data to try to identify when a stock is likely to rise or fall. Technical analysis can be controversial, but many investors swear by its usefulness.
- If you’re not in it for the profits, maybe you’re in it for the silly names. Hanging men, spinning dragons, and rounded bottoms are some of the other types of indicators technical analysts may look for.
- Although technical analysis is often associated with individual day traders, big-name professional investors like hedge funds, and investment banks often use it as well.
- With technical analysis, investors try to identify when a stock is going to rise or fall by looking at its past price movements.
- In addition to price data and patterns, technical analysts may look at a stock’s trading volume and volatility data.
- Technical analysis stands in contrast to fundamental analysis in which investors try to gain a thorough understanding of a company’s business prospects in order to invest in companies with bright futures.
- Technical analysis is controversial. Some investors argue it’s a load of baloney, while others say it works for them.