Lesson 7: Stock Performance and Getting Started Investing
Before you buy a stock (and after you’ve invested!), you’ll want to know how it has performed. This is where a stock chart comes in handy.
What’s in a stock chart
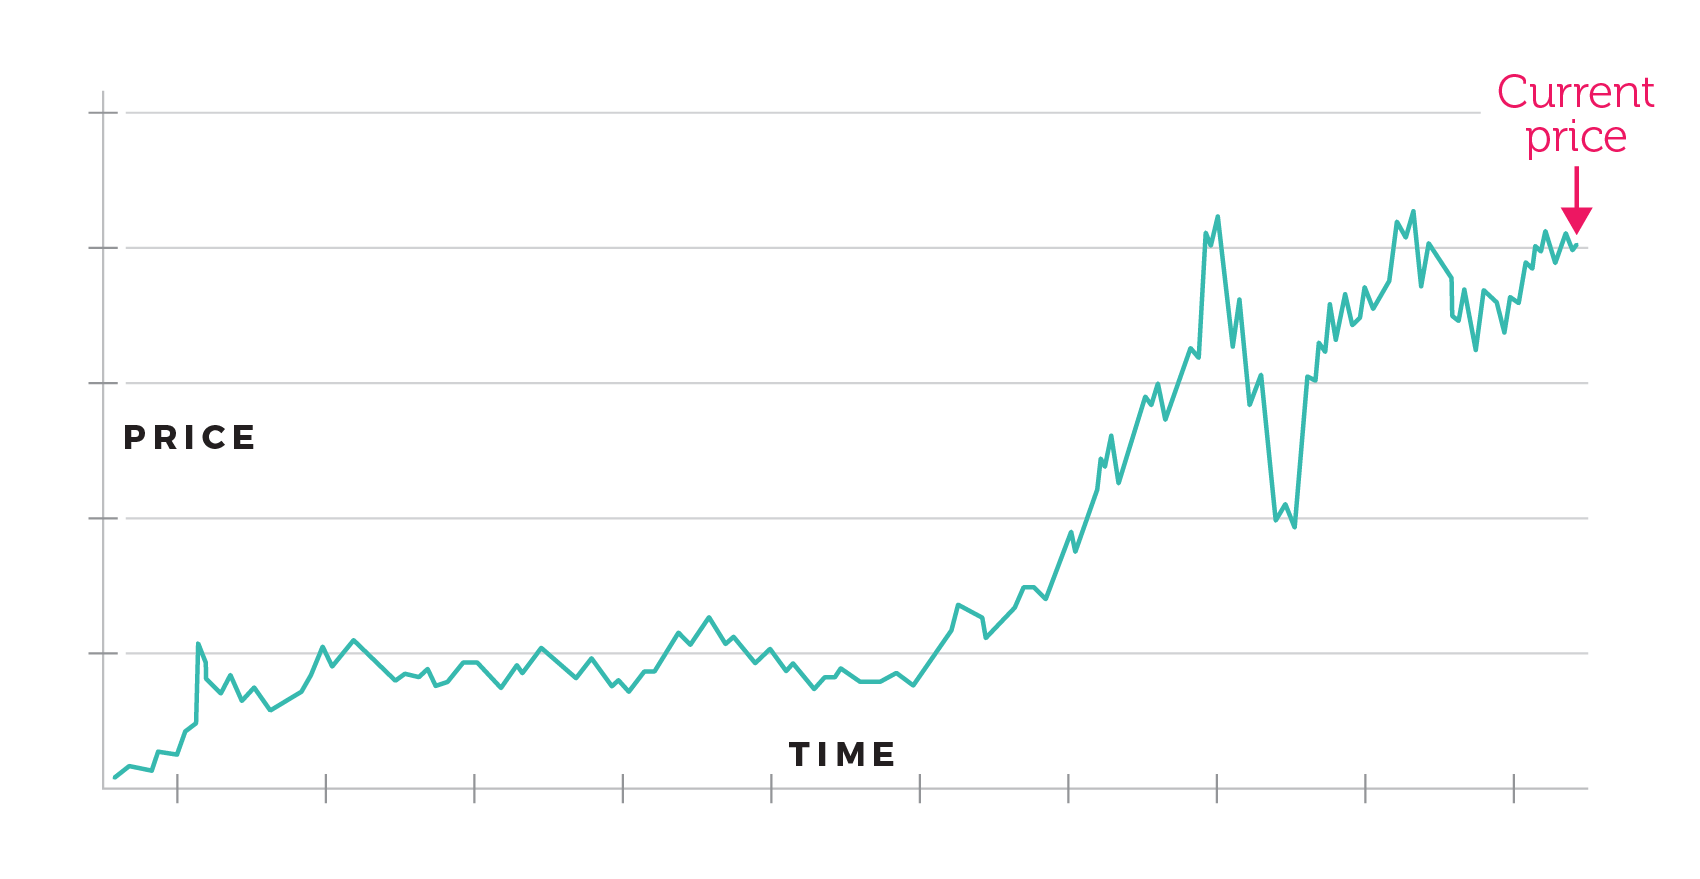
A stock chart shows the price of a company’s shares over a set period of time, ranging from as little as one day to as long as multiple years. It typically includes several key pieces of information:
- The ticker symbol used to identify the stock on the exchange
- The exchange where the stock is traded (NYSE, Nasdaq)
- The time period the chart covers
- The highest and lowest prices the stock traded at during the time period as well as its last trading price
- The net change in the stock’s price since the market closed the previous day

Some stock charts also tell you if and when a company paid out dividends and how much they paid.
Understanding stock returns
Stock returns—or how much money an investment in stock made or lost over time—give you another glimpse into a stock’s performance.
There are two main types of stock returns:
- Price returns: These show how much a stock has gained or lost in price.
- If you buy a stock at $20 a share and sell it for $22 a share, your return is $2 a share, or $2 / $20 = 10%.
- Total returns: These look at buying and selling prices but also take dividends into account.
- If that same stock also paid out a $2 dividend, your total return is the combined $4 a share, or $4 / $20 = 20%.
Because total returns include more than just price changes, they are generally seen as giving investors a more complete picture of a stock’s performance.
If you’ve got a calculator, you can figure out a stock’s total return using this simple formula:
+ Value of investment at the end of the year
– Value of investment at the beginning of the year
+ Dividends
____________________________
Dollar value of your total return
(Dollar value of your total return) / (Value of at the beginning of the year) = % Total return
Understanding relative performance
Looking at a stock’s relative performance is another way to see how well it’s doing. In relative performance, you either compare one stock against other similar stocks (comparing American Airlines stock against Delta and United, for example) or against a specific index (such as the S&P 500, Dow Jones Industrial Average, or Nasdaq Composite).
Considering a stock’s relative performance can help you understand if it’s doing well (or poorly) because all stocks are doing well or if its performance is driven by developments at that specific company.
What it is and what it isn’t
It’s important to understand that a stock’s past performance is not a crystal ball: It does not tell you how a stock will perform in the future. But it can help you spot patterns in a stock’s past returns that can help you make informed decisions about if and when to invest in that stock (or when to sell, if you already own the stock).
Getting started investing in stocks
Now that you know the ropes, how can you get started actually investing in stocks? Here are the basic steps:
- Decide how much you want to invest and how often: This could be a one-time thing, weekly, monthly, annually, or whenever you feel like it.
- Determine how you want to invest: You can be a hands-on investor, making decisions about when to buy and sell and what to buy and sell, or you can hire someone to do that for you.
- Open an investment account: You can do this either through a broker or a robo-advisor, which is an account managed by a computer algorithm set to your preferences. Today, many accounts can be opened for a small starting investment and incur low (if any) fees.
- Select your stocks or funds (and the number of shares): This goes back to #2. You can pick what you’d like or have it done for you.
- Buy and sell stocks and funds and (hopefully) make money!


